This map is showing Australia's land forms for each region.

Landform map provided from: https://www.google.com/search?q=australia+landform+maps&client=firefox-a&rls=org.mozilla:en-US:official&channel=np&tbm=isch&tbo=u&source=univ&sa=X&ei=z9WMU6_3FY-DogSSk4DQDQ&ved=0CB8QsAQ&biw=1366&bih=657
This map of Australia is the catchment area showing were all the snow melt and rain fall runoff end up in each region. It is also showing the percent of runoff in each region.

Water catchment map provided from: https://www.google.com/search?q=australia+water+maps&client=firefox-a&hs=YHF&rls=org.mozilla:en-US:official&channel=np&tbm=isch&tbo=u&source=univ&sa=X&ei=7dSMU5wig7uhBO-uguAE&ved=0CCEQsAQ&biw=1366&bih=657
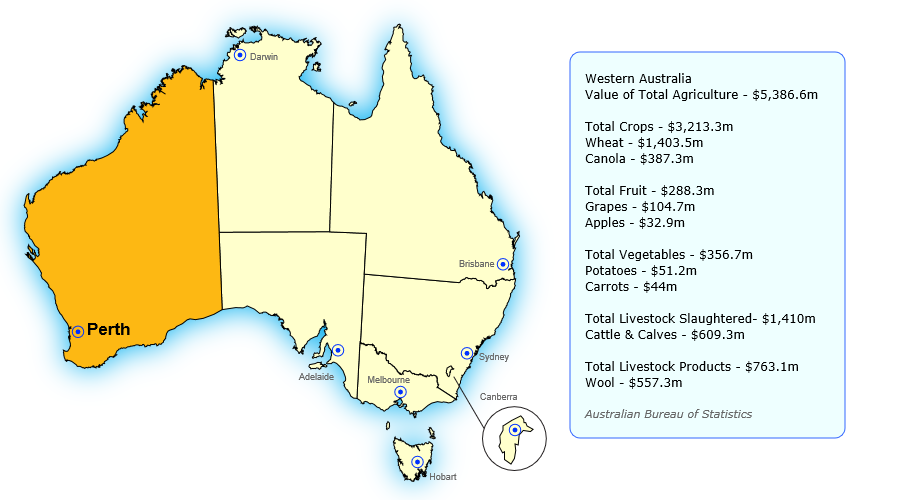
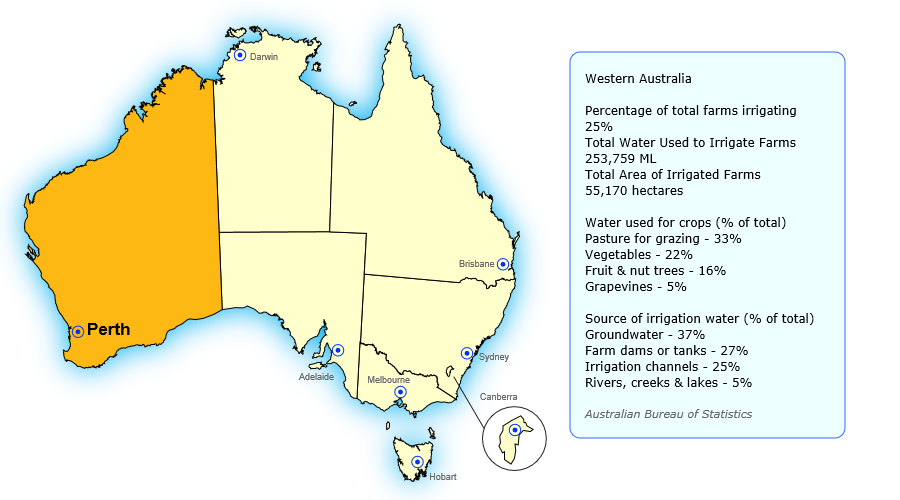
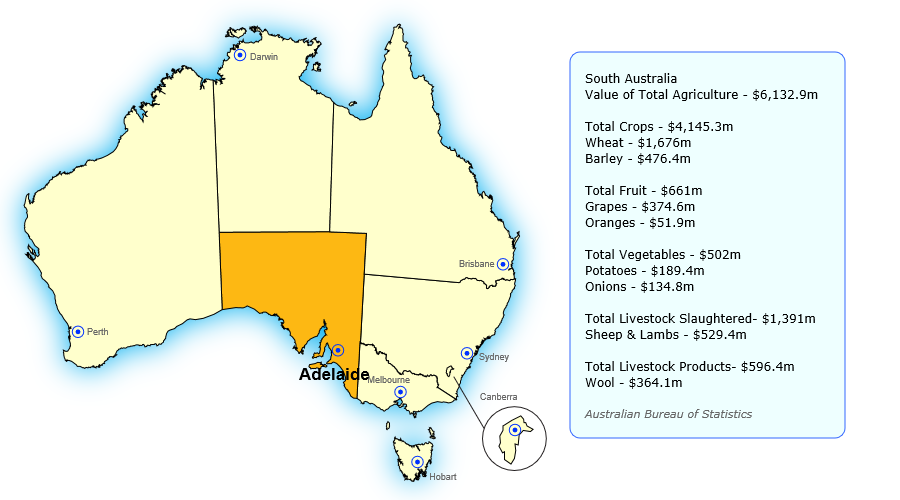
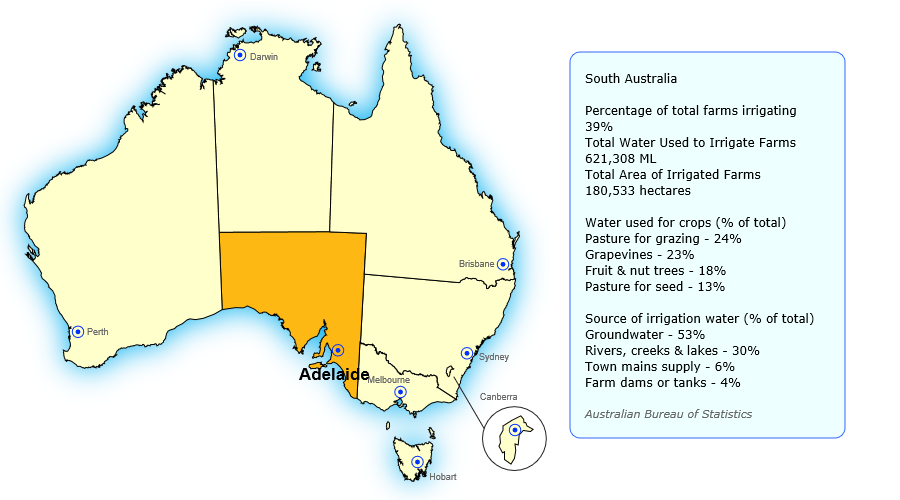
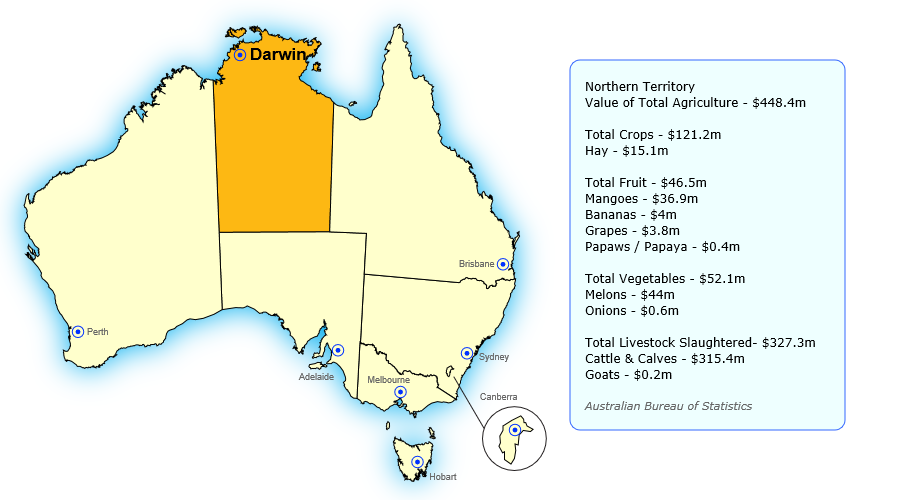
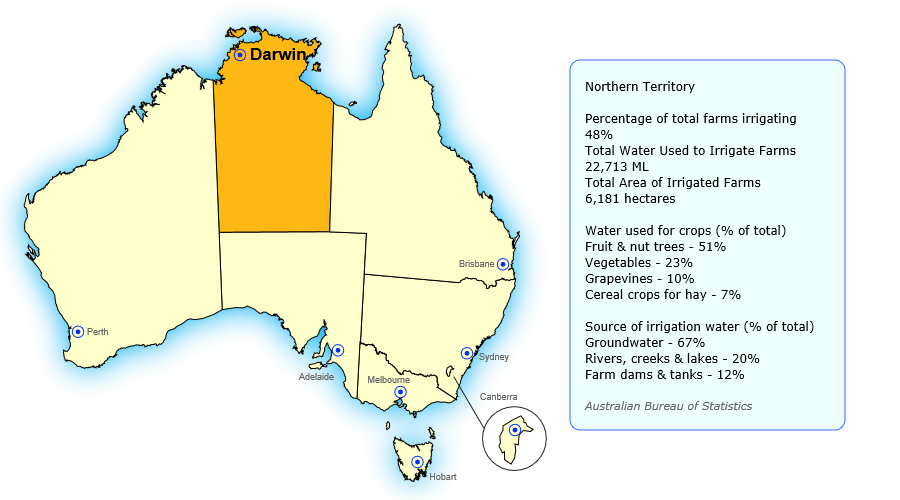
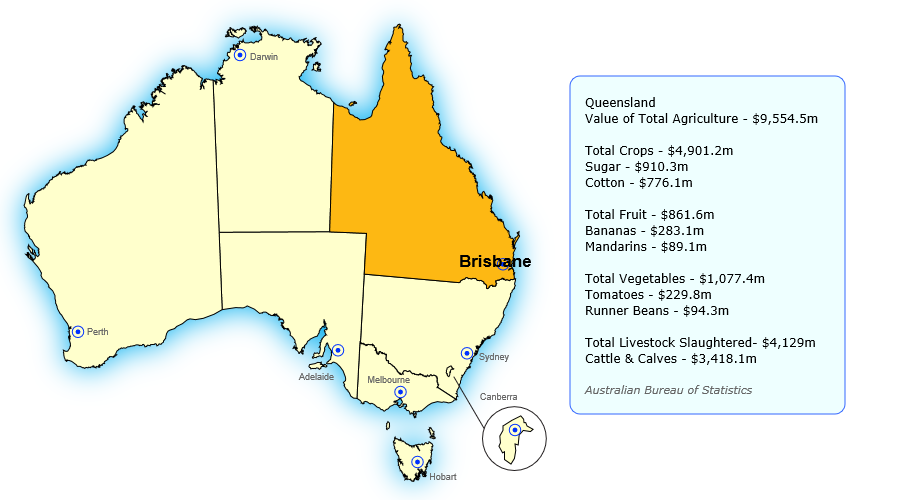
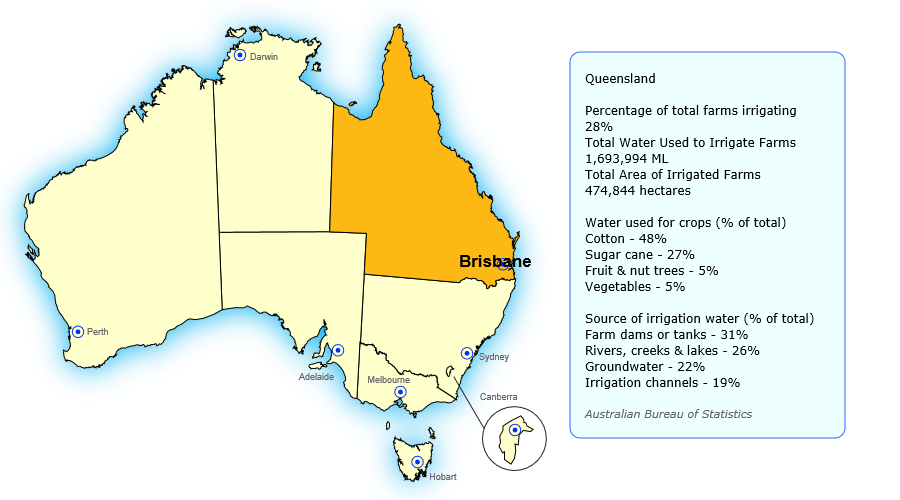
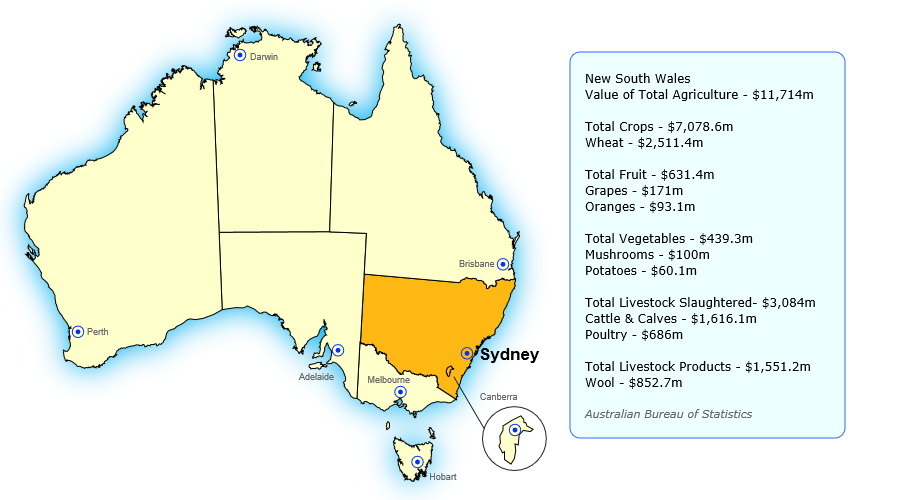
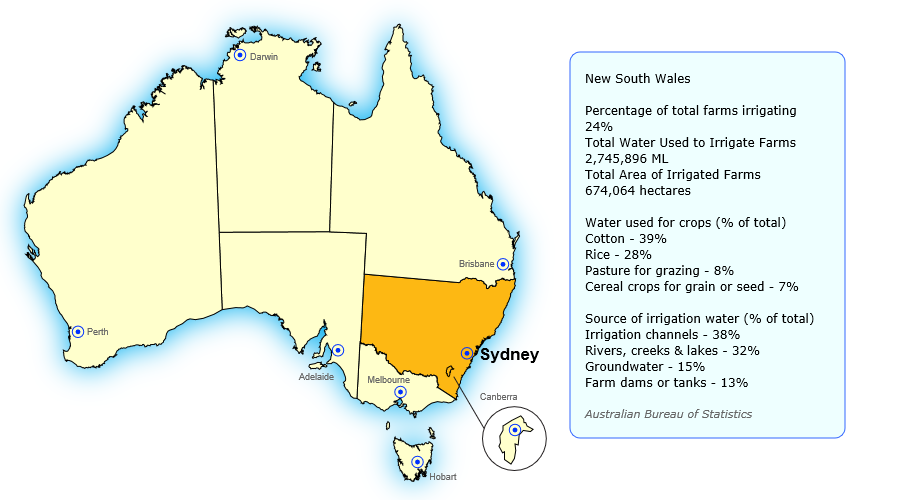
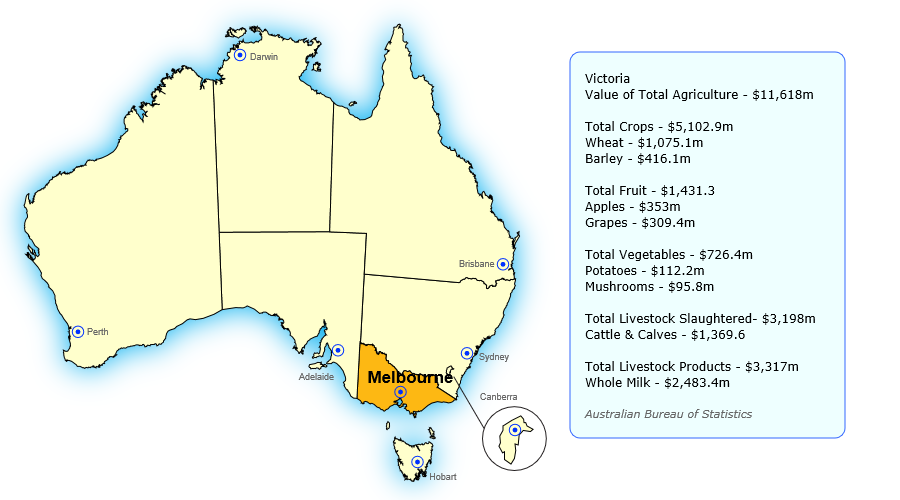
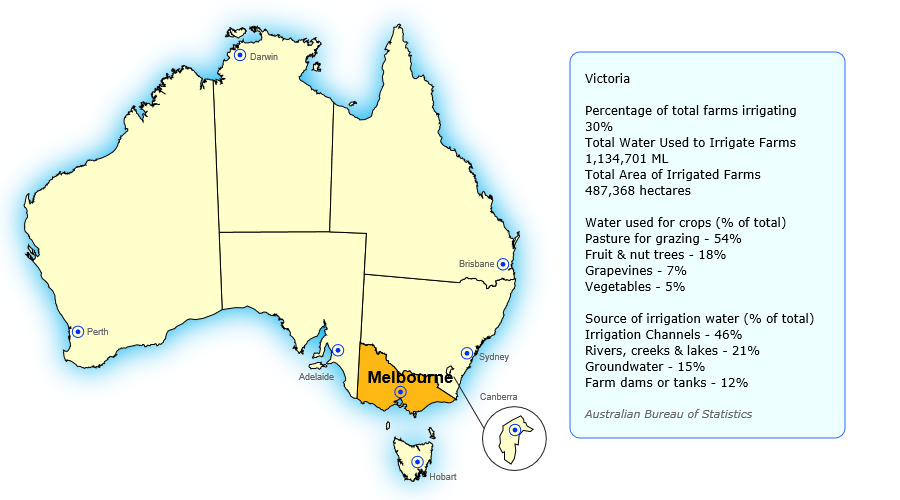
The maps below show Australia's regions of agricultural production. The first map of every region shows the tonnes produced, map two shows the economic of each product produced, and the third map shows the water used to grow each product an
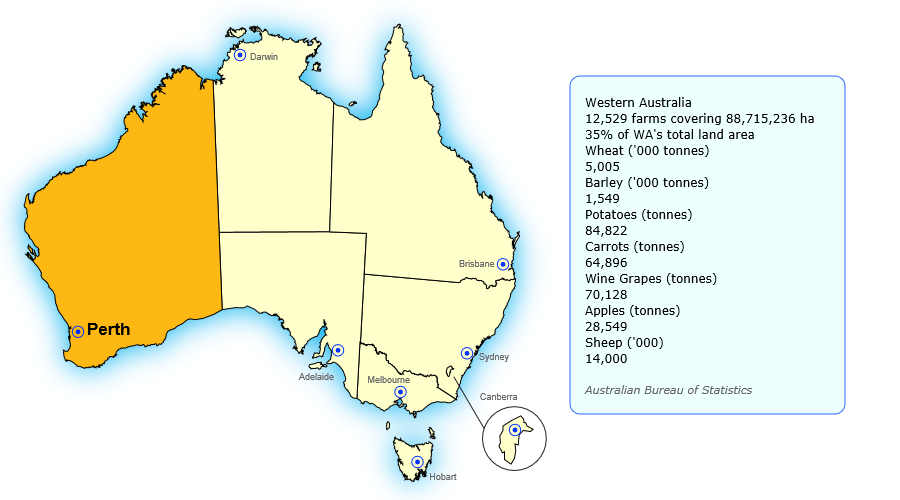
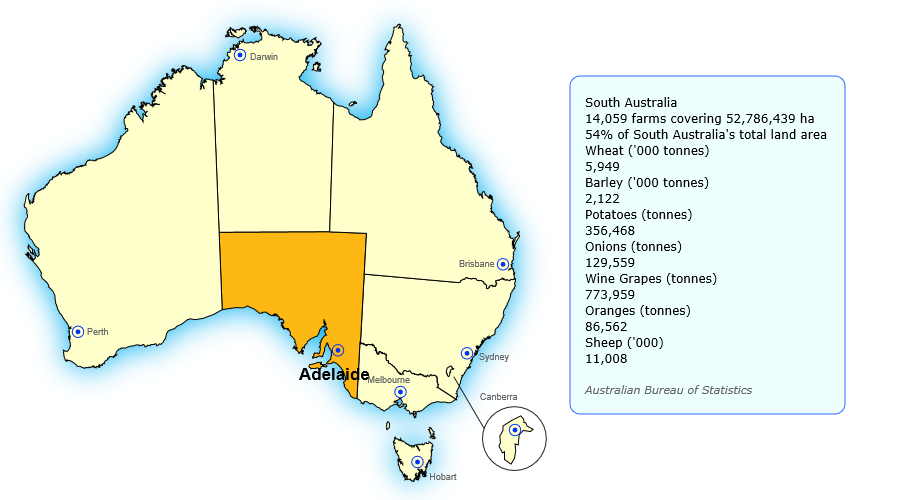
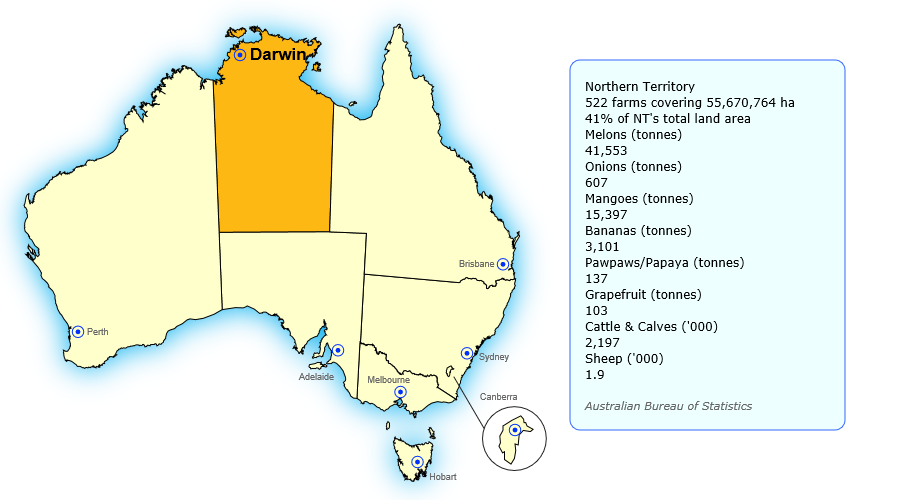
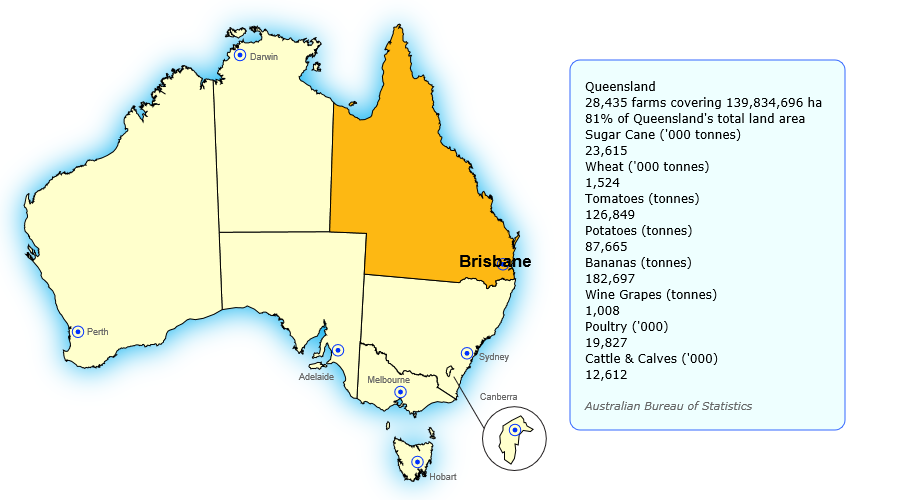
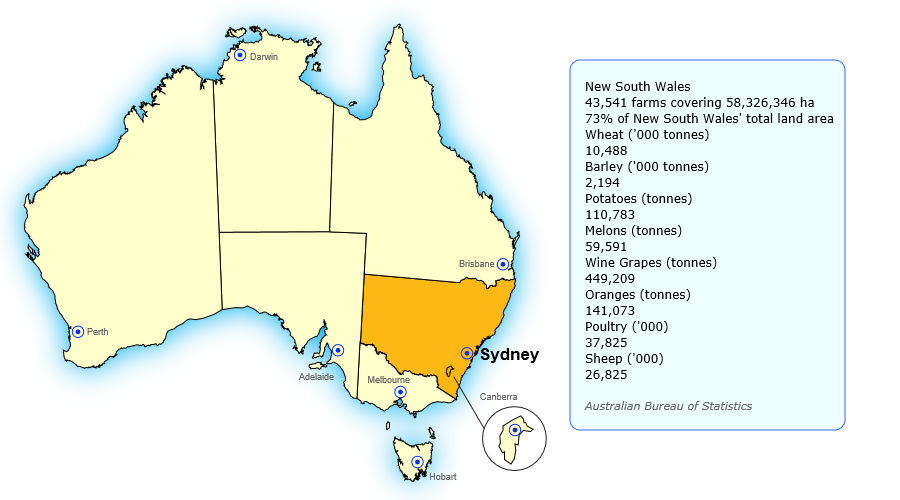
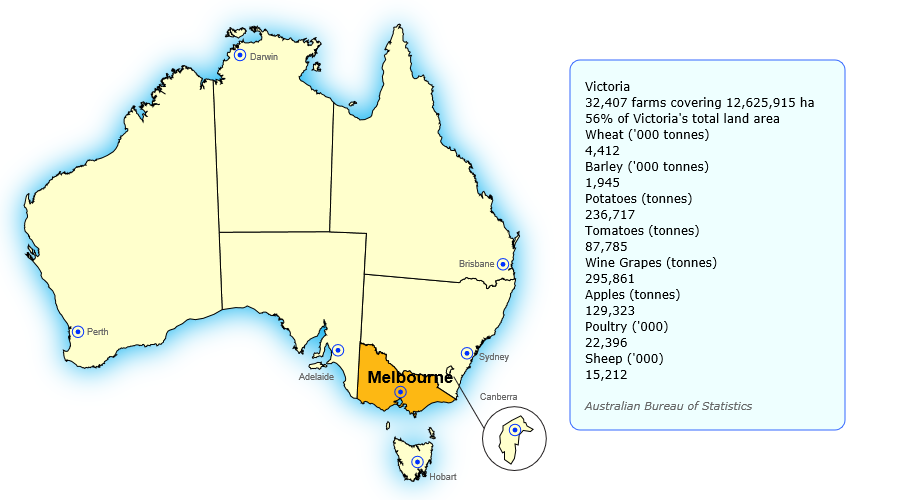
Australian Bureau of Statistics. (2011), Agricultural Commodities. Maps and data retrieved from http://www.abs.gov.au/websitedbs/c311215.nsf/web/agriculture+-+agricultural+census
Australian Bureau of Statistics. (2011), Value of Agricultural Commodities Produced. Maps and data retrieved from http://www.abs.gov.au/websitedbs/c311215.nsf/web/agriculture+-+agricultural+census
Australian Bureau of Statistics. (2011), Water Used on Australian Farms. Maps and data retrieved from http://www.abs.gov.au/websitedbs/c311215.nsf/web/agriculture+-+agricultural+census
Australia’s Total Agricultural Commodities In Tonness
One Tonnes = 2,204.62262 US pounds
Wheat 27,378
Wine Grapes 1,590,165
Sheep 67,046.9
Barley 7,810
Oranges 227,635
Mangoes 15,397
Apples 157,872
Bananas 185,798
Potatoes 876,455
Onions 130,166
Carrots 64,896
Melons 101,144
Grapefruit 103
Papaya 137
Sugar Cane 23,615
Poultry 80,048
Tomatoes 214,634
Cattle and Calves 14,809
Australia’s Total Agricultural Commodities Value Per year:
$44,890.4 Million

SOURCES OF AGRICULTURAL WATER:
In 2010-11, 29% of Australia's agricultural water (2,217 gigalitres) came from irrigation channels, and 27% (2,050 gigalitres) was sourced from rivers, creeks and lakes. Around 21% of agricultural water (1,611 gigalitres) came from groundwater, whilst farm dams and tanks accounted for 18% of agricultural water (1,375 gigalitres).
In 2010-11, water supplied by irrigation channels was the major source of water for agriculture in the Murray-Darling Basin, accounting for 35% of agricultural water sourced in the region (1,705 gigalitres).
Outside the Murray-Darling Basin, groundwater was the major source of water for agriculture at 38% (1,042 gigalitres).
AGRICULTURAL WATER USE:
Australia's total agricultural water use in 2010-11 was 7,551 gigalitres.
Almost two thirds (64%) of this use was in the Murray-Darling Basin, which amounted to 4,815 gigalitres.
The states using the most water were New South Wales with 2,982 gigalitres and Queensland with 1,960 gigalitres.
1 gigalitres = 219,969,157 Imperial Gallons or
264,172,052 US Gallons
IRRIGATION ACTIVITY BY STATE AND TERRITORY:
New South Wales irrigated the greatest area of land with 674,000 hectares, or 34% of the national agricultural land irrigated. Victoria irrigated 25% of the national total (487,000 hectares) and Queensland irrigated 24% (475,000 hectares). 1 hectare = 2.47105 acres
In 2010-11, New South Wales was the largest user of water for irrigation at 2,746 gigalitres, followed by Queensland at 1,694 gigalitres. Together these two states used around two-thirds of the irrigation water used in Australia.
The national application rate was 3.4 ML/ha, with Western Australia having the highest rate at 4.6 ML/ha.
IRRIGATION ACTIVITY BY MURRAY-DARLING BASIN:
In 2010-11, the total agricultural area irrigated in the Murray-Darling Basin (MDB) was 1.2 million hectares, which represented 61% of all irrigated land in Australia.
Around 57% of irrigation water used in the MDB was in the New South Wales, MDB area (2,584 gigalitres).
The application rate of irrigation in the MDB was 3.8 ML/ha, where as the application rate for the Non-MDB was 2.8 ML/ha. The highest application rate in the MDB was in the South Australian MDB area at 4.7 ML/ha, whereas the lowest was in the ACT MDB area at 1.5 ML/ha.
IRRIGATION ACTIVITY BY COMMODITY:
In 2010-11, the largest area of irrigated land in Australia was pasture for grazing, which accounted for 538,000 hectares, or 27% of the total area irrigated.
The largest volume of irrigation water was applied to cotton, which used 1,882 gigalitres, or 28% of the national irrigation total for the year (6,645 gigalitres).
In the Murray-Darling Basin, cotton accounted for the largest area of irrigated land, with 332,000 hectares, or 28% of the total irrigated land in the Murray-Darling Basin.
Cotton also used the largest volume of irrigation water in the Murray-Darling Basin, with 1,789 gigalitres being applied, which represented nearly 40% of all irrigation water used in 2010-11.
The commodity with the highest irrigation application rate in 2010-11 was rice, which used 10.1ML/ha in the Murray- Darling Basin and nationally.
Australia water news Water Sustainability in Australia:
Australia’s (CSIRO) Commonwealth Scientific and Industrial Research Organization- Creating sustainability provided innovative technology.
Through:
1) ocean systems and climate processes
2) efficient land-use practices
3) improved irrigation
4) new water re-use and treatment technologies
5) integrated social and economic analysis
6) monitoring and predictive tools
