The Basic to Water Science:
Hydrological Cycle

Water Cycle

Australia
climate information
All statistics and data in Australia's climate information provided by Australia Bureau of Meteorology. In 2013 Australia had its warmest spring on record. This year Australia’s mean temperatures were up 1.57°C above average breaking the old record of 1.43°C (set in 2006) by 0.14°C. These mean temperatures are all higher than the 1961 – 1990 average for which Australia is basing their data. The daytime maximum temperatures set a new high record at 2.07°C above average and nighttime minimum temperatures set a new fourth warmest on record at +1.07°C. September, October, and November all saw above average mean temperatures. September had a +2.75°C breaking the old record by more than a degree. October was at 1.43°C above average mean and November came in at 0.52°C above the average mean temperature.
The warmer springs are consistent with the overall warming trend that is happening in Australia. Since 1910, Australia has seen its temperature rise by about 1° C. There are combinations of factors that go into this warming trend. They are, the big one global warming, dry conditions that are affecting most of central and eastern Australia, and unusually strong winds coming from the west.
Bureau of Meteorology. (2014), Climate change and variability. Spring 2013: Australia’s warmest spring on record. www.bom.gov.au/climate/change/
This map of Australia is the catchment area showing were all the snow melt and rain fall runoff end up in each region. It is also showing the percent of runoff in each region.
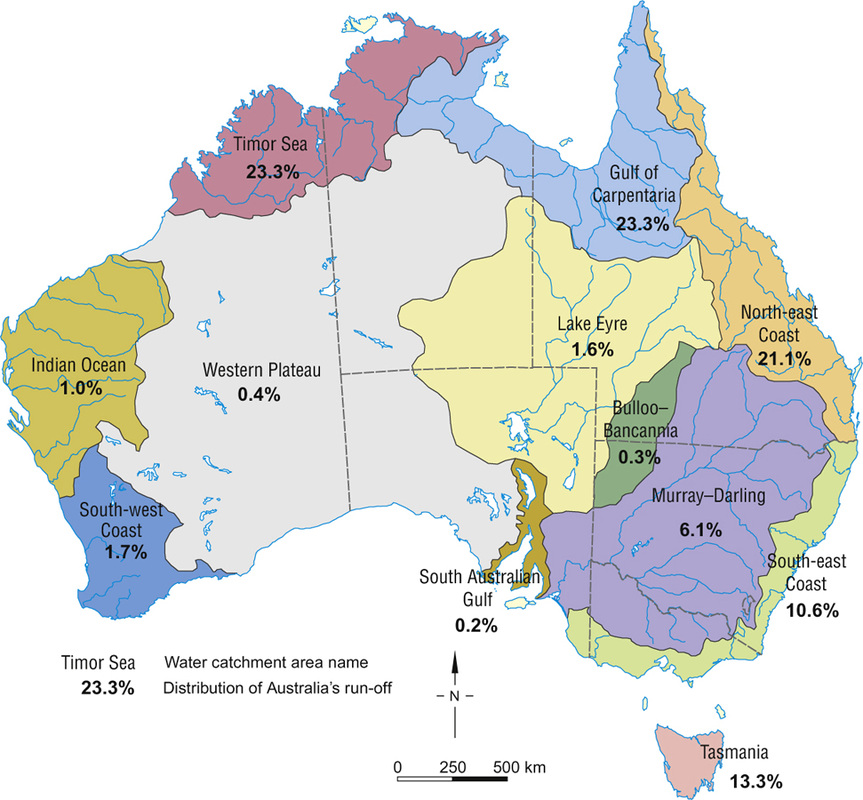
Landform map provided from: https://www.google.com/search?q=australia+landform+maps&client=firefox-a&rls=org.mozilla:en-US:official&channel=np&tbm=isch&tbo=u&source=univ&sa=X&ei=z9WMU6_3FY-DogSSk4DQDQ&ved=0CB8QsAQ&biw=1366&bih=657
The map below is from the Bureau of Meteorology and is showing the maximum temperature in Australia from June1, 2013 to May 31, 2014.
Commonwealth of
Australia. (2014), Twelve-monthly mean maximum temperature for Australia. http://www.bom.gov.au/jsp/awap/temp/index.jsp?colour=colour&time=latest&step=0&map=maxave&period=12month&area=nat
The map below is from the Bureau of Meteorology and is showing a twelve month rainfall comparison between June 2010 to May 2011 and June 2013 to May 2014.
Commonwealth of Australia. (2014), Twelve-monthly rainfall comparisons this year minus three years ago – Australia. http://www.bom.gov.au/jsp/awap/rain/index.jsp?colour=colour&time=latest&step=0&map=iadiff3&period=12month&area=nat
The map below is showing all water sources used in each region of Australia.
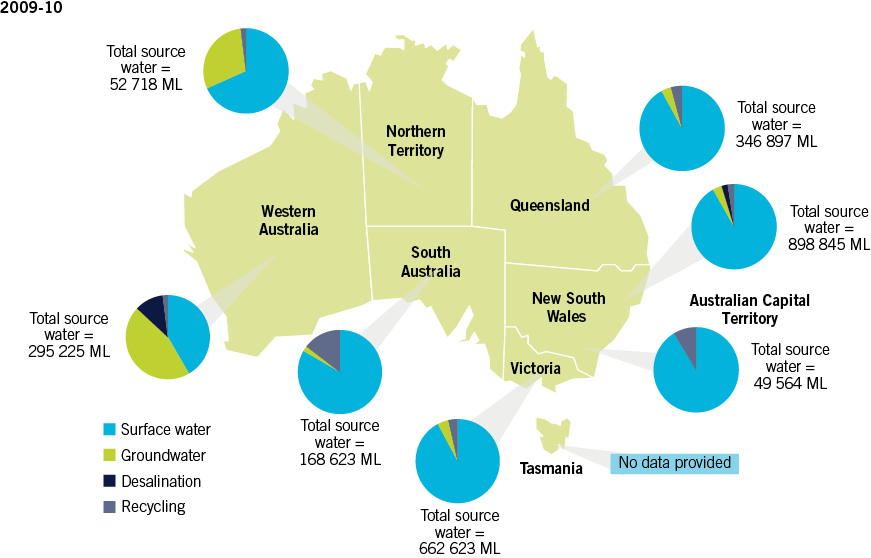
(National Water Commission, 2014)
The map below is showing Australia's water consumption by each region.

National waster commission. (2014),Water source breakdown. http://www.nwc.gov.au/publications/topic/nprs/npr-2013-urban/2-drivers-of-performance
